Measure the quality of your survey on a case-by-case level to reliably detect fraudulent responses and ensure a trustworthy foundation for your insights
The quality of survey data can be adversely affected by a variety of factors during fieldwork, ranging from technical glitches to biased panel selection and fraudulent responses. The ever-changing nature of these issues, particularly in the case of fraud, means that there is no silver bullet for solving this problem for all cases. Rather, the data has to be inspected from multiple perspectives to surface the majority of the problem cases.
In our work, we have found that best results can be achieved by comprehensively considering both context, e.g., survey meta-information about the duration to complete a questionnaire or the participant's location, and content, e.g., the proportion of 'No Opinion' response given or the overall response distribution, that together fully describe each survey case.
Our Survey Quality Assessment can be split into three key analytical components:
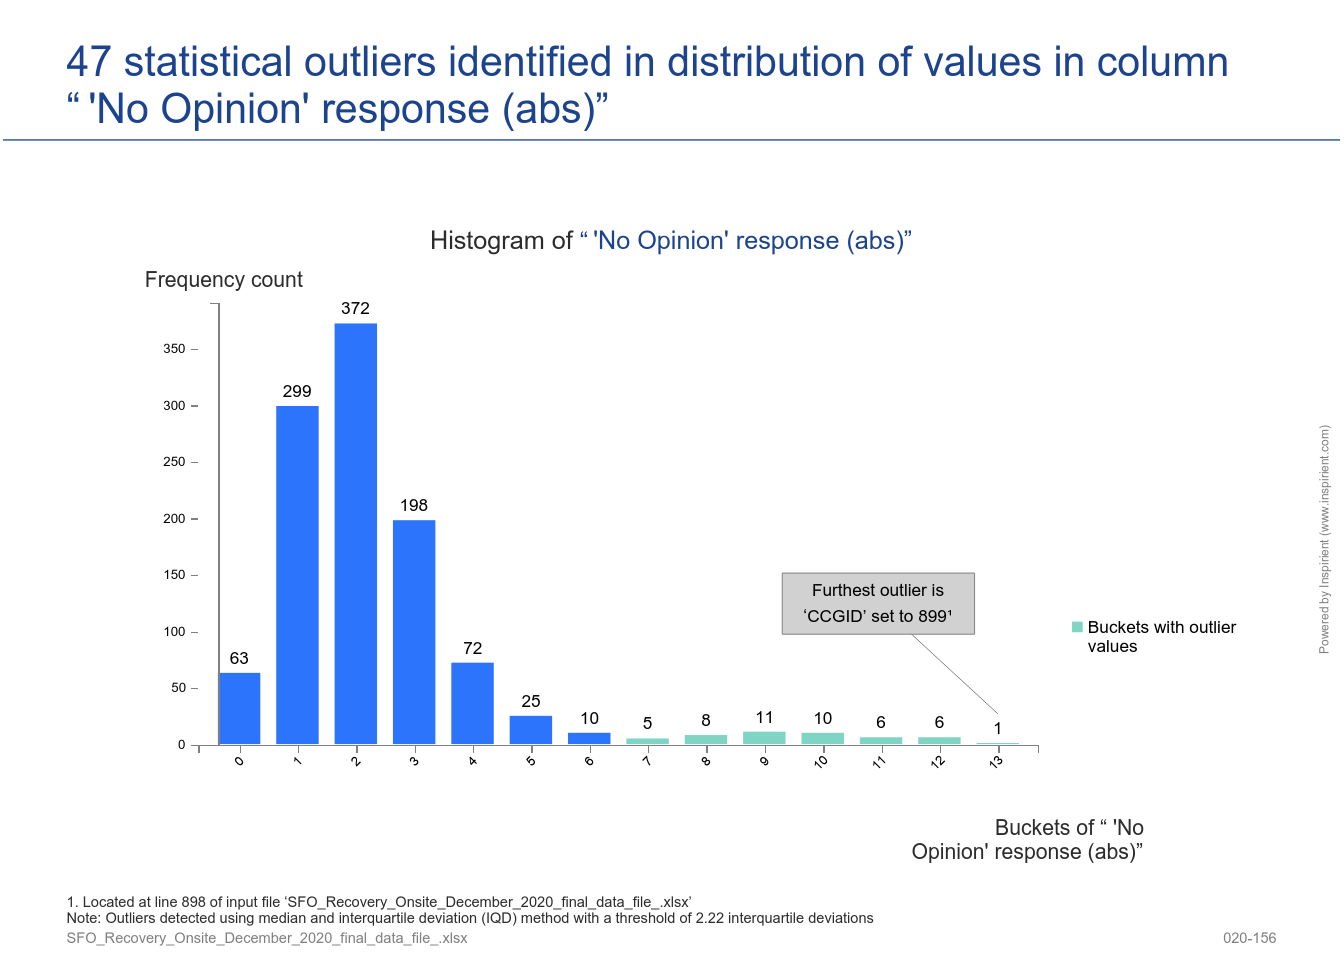
- 'No Opinion' proportion and response entropy, i.e., are there cases, or even segments, with an abnormally high proportion of 'No Opinion' responses or with a poor richness of responses?
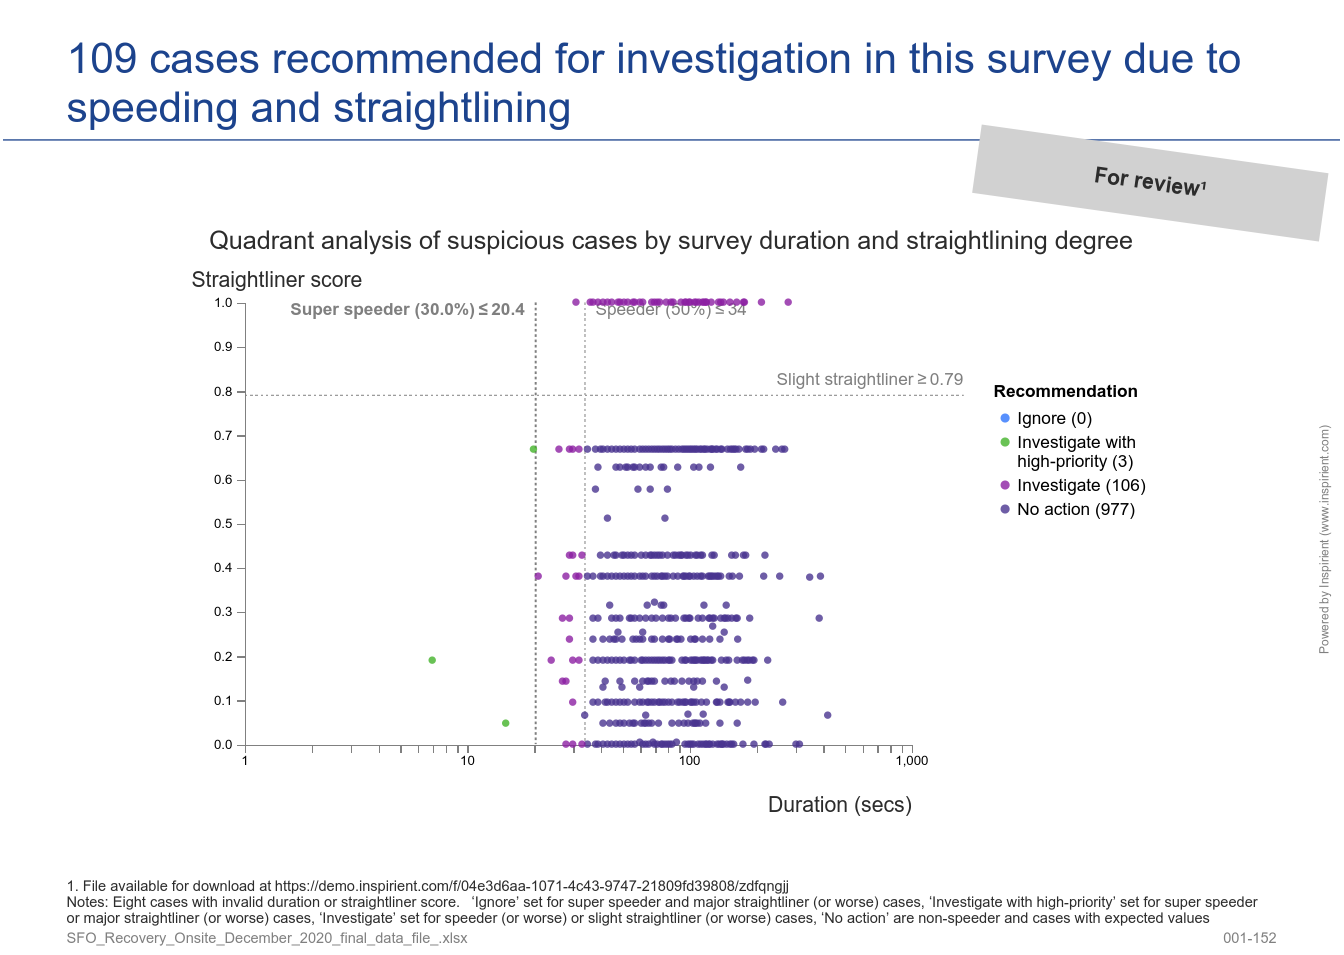
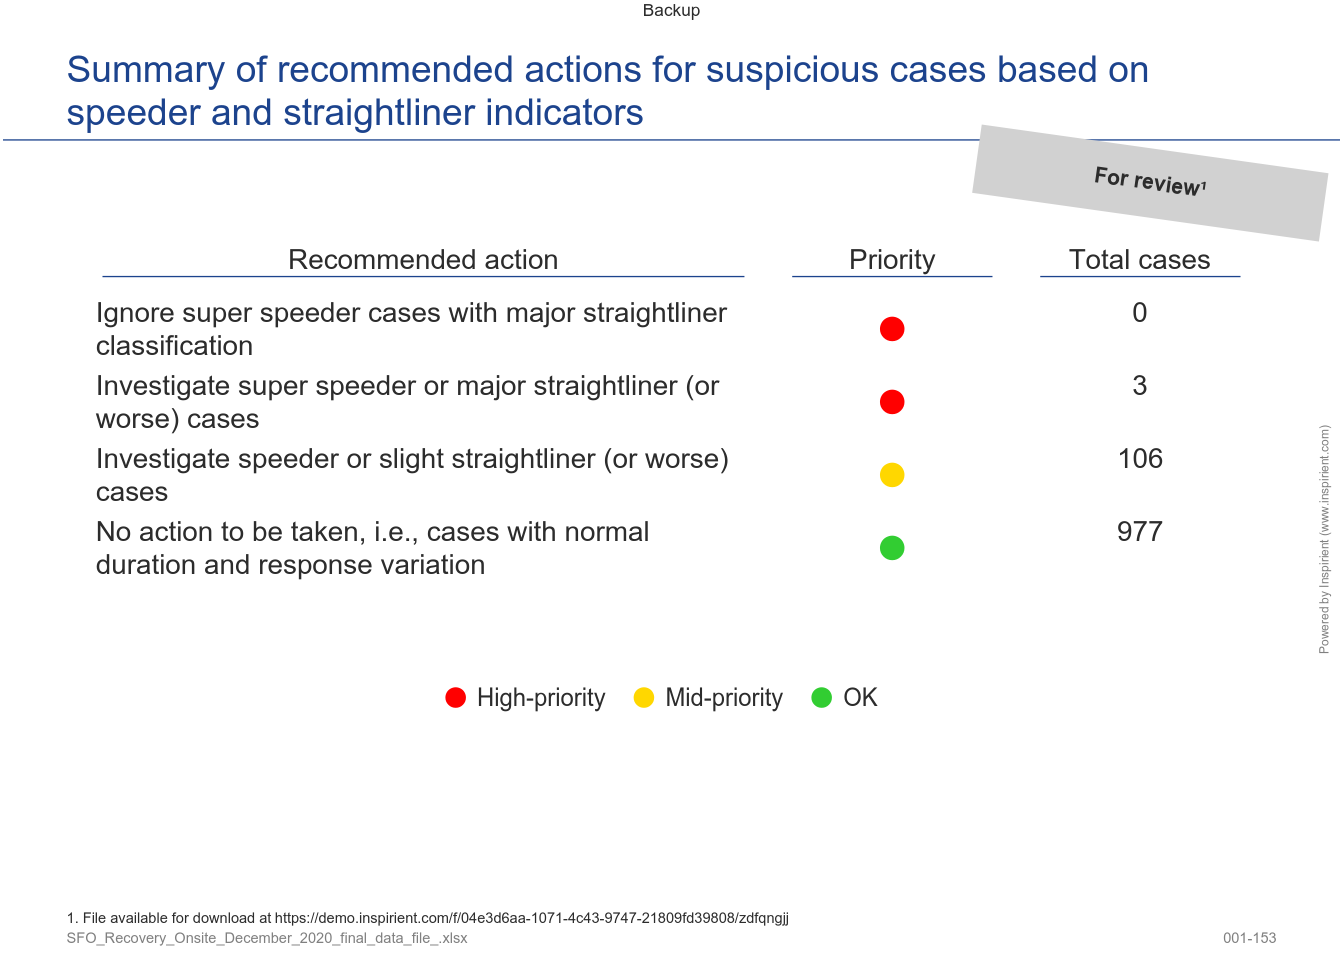
- Straightliner and speeder detection, i.e., are there any survey cases where the participants answered the questionnaire with nonsense responses to complete survey as quickly as possible?
- Interviewer effect analysis, i.e., if interviewers are conducting the research, are you sure they are, intentionally or unintentionally, introducing bias into the results, or, in the worst case, forging survey results?
The following sections describe the three components in detail.
1. 'No Opinion' Proportion and Response Entropy
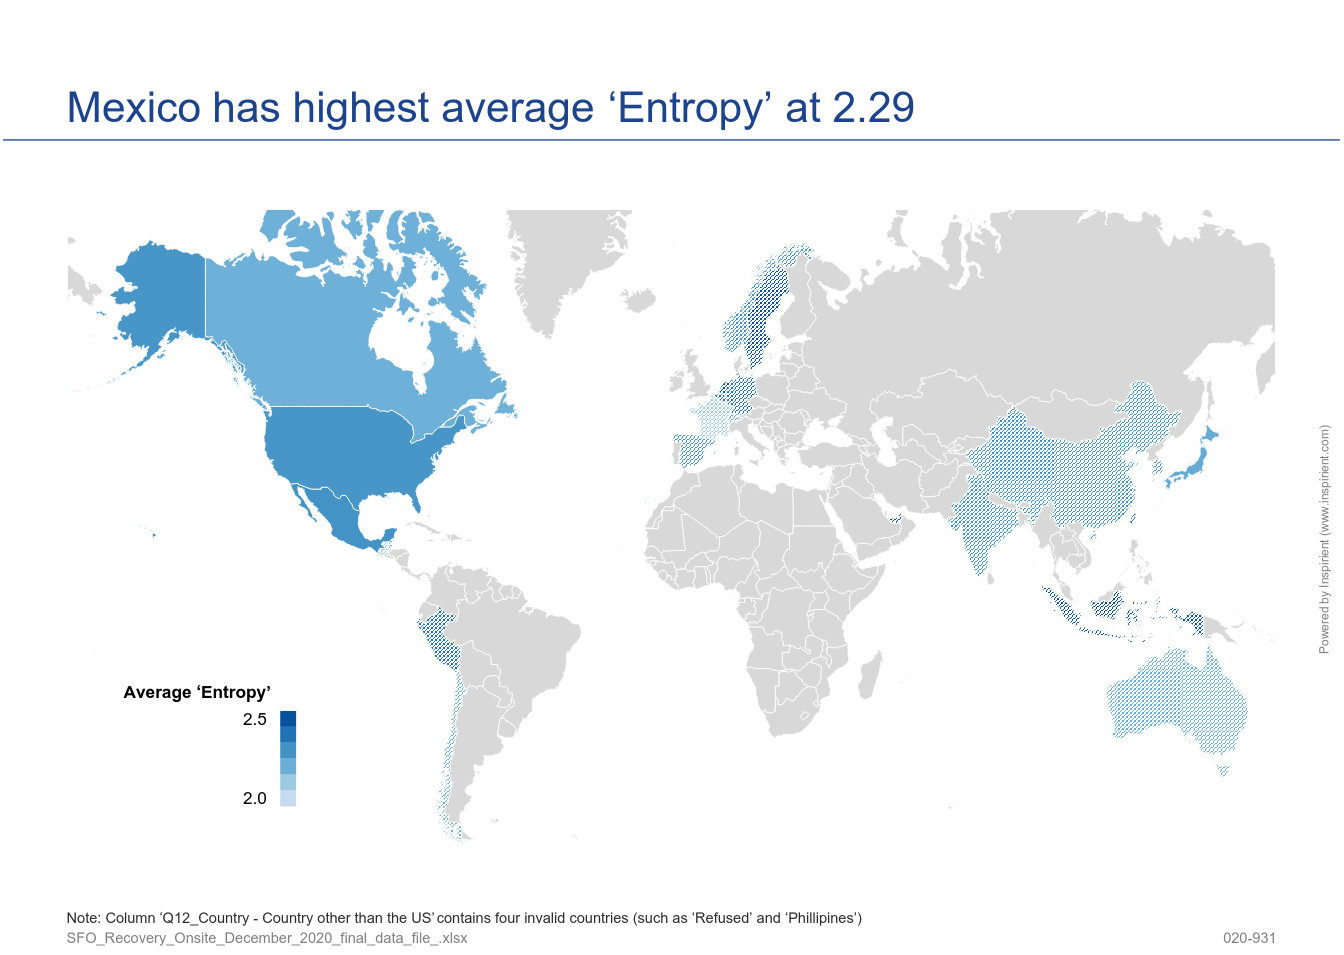
This survey quality component catches the richness of the survey content, on a case-by-case-level, from two angles. The first angle looks at how often participants opted out of providing a response by selecting a given 'No Opinion' choice. The second angle estimates the richness of valid responses for a given case using a statistic from the field of Information Theory called entropy1.
2. Straightliner and Speeder Detection
This survey quality component identifies potentially unreliable cases by inspecting both survey content (detection of straightliners) and context (detection of speeders) and, as a final step, contrasted to increase accuracy of the classification of spurious cases.
For straightliner detection, our system calculates a score (between 0 and 1) which defines the degree to which a case is considered as a straightliner or not. This differs from existing solutions since most only detect 100% straightliner cases therefore cases slightly below will go undetected (full specification).
For speeder detection, our system detects cases with abnormally short or long duration using the generalized ESD (Extreme Studentized Deviate) test on any specified duration variable in additional to specifying a threshold relative to the median duration (default values are 50% for speeders and 30% for super-speeders).
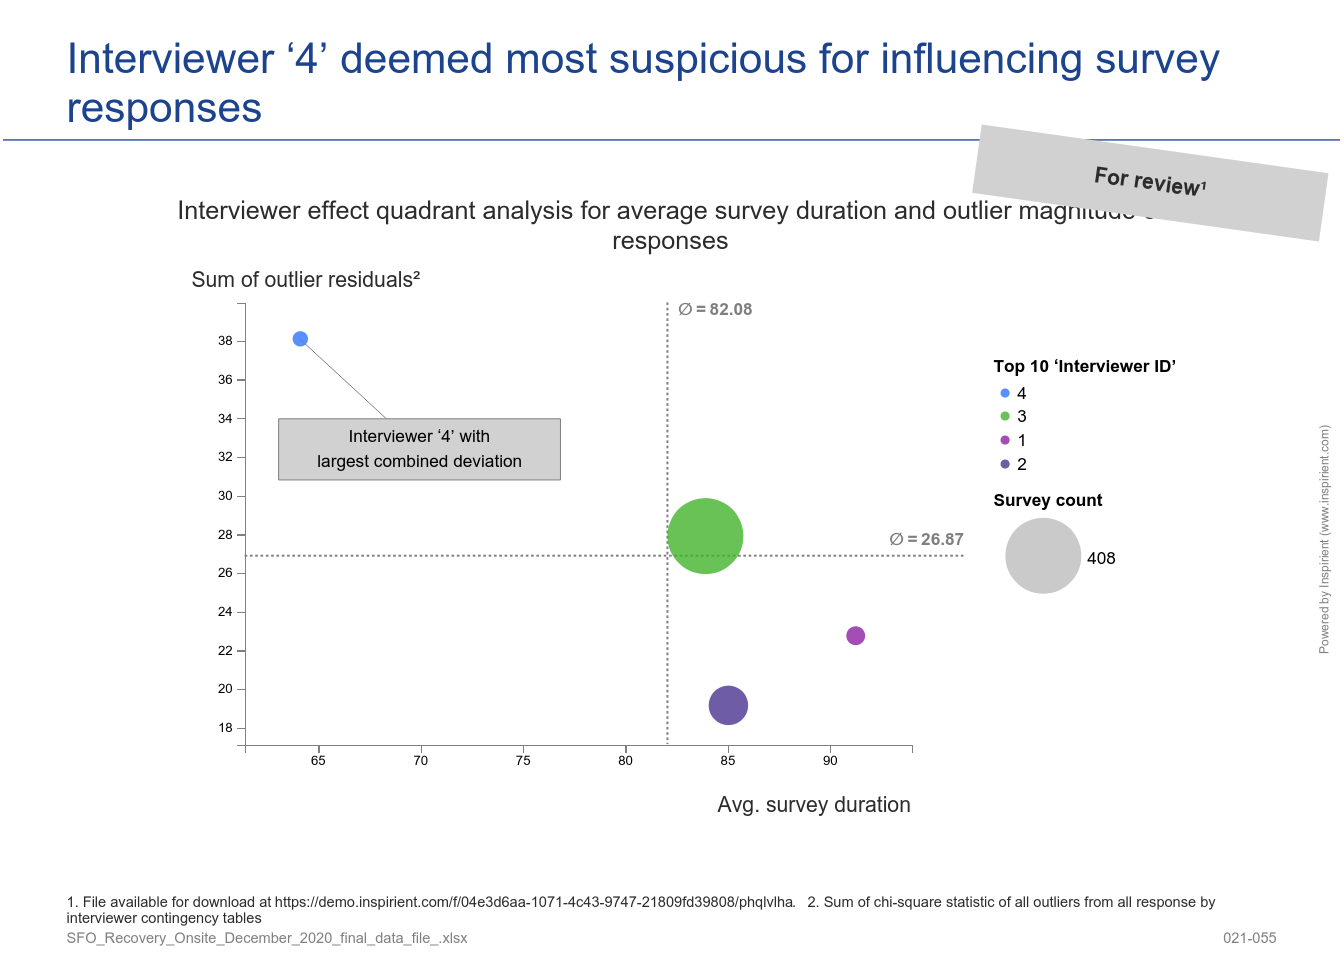
3. Interviewer Effect Analysis
This survey quality component provides a data-driven estimation of the trustworthiness of each interviewer for a given survey. This indicator combines two factors: Degree of survey response deviation from the expected response distribution (content) and the degree of interview duration deviation from the expected time to complete the survey (context). The survey response deviation score is calculated by locating outliers in expected vs. actual frequency distributions of survey response variables for each interviewer – the interviewers with the most deviations across interviews are surfaced to the top and could indicate foul-play (full specification).
The benefits of applying these three analytical components in a commercial opinion polling / market research setting are detailed in our case study Survey Quality Assurance at Verian.
References
- Wikipedia. Entropy (information theory).
In cooperation with
 and
and

The Inspirient Automated Analytics Engine automates the entire data analytics process end-to-end: From the assignment of input data, pattern and outlier detection, automated visualization of patterns, weak points and opportunities to automatic generation of textual explanations and recognition of the underlying relationships and rules. Most other analytics solutions rarely include these textual explanations and observations regarding the underlying data relations, which are both critical to provide a deeper level of analysis and more actionable conclusions.