Reach higher levels of profitability through optimized key business levers and metrics, e.g., price points and contribution margins
Continuously adapting key business levers such as price points can be a challenge. At the same time, leaving levers at a suboptimal setting for any length of time results directly in foregone profits. And similarly, just understanding how key metrics behave in varying market conditions is at times not feasible, especially on a detailed, actionable level of detail such as for specific stock keeping units (SKUs).
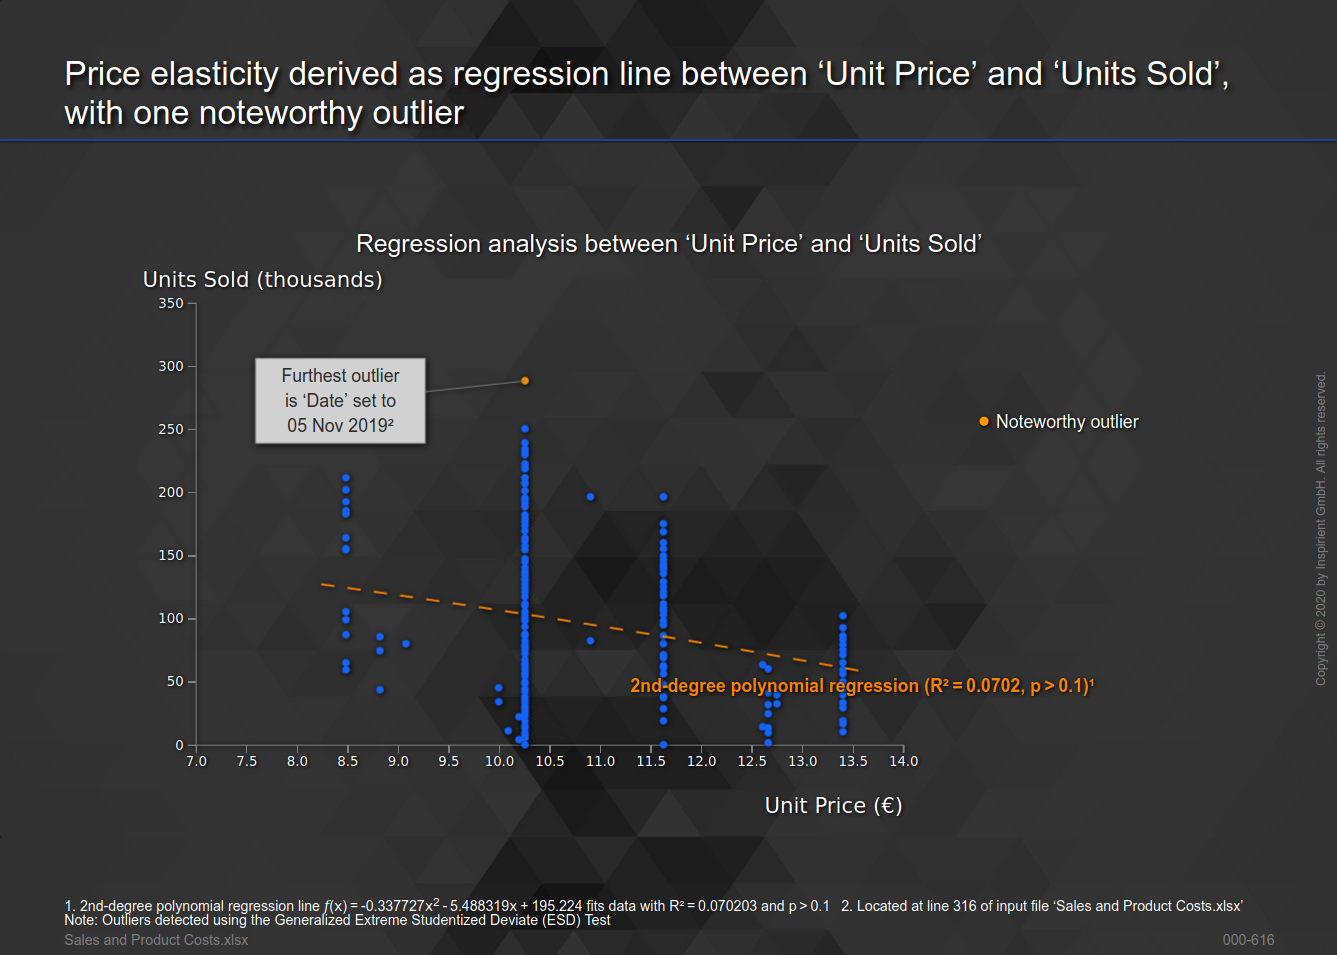
Analytically, both of these issues can be addressed via automated optimal curve fitting. For example, if information on the number of units sold and price points is available, this method can derive the best-fit price elasticity curve, down to the mathematical model. With this model, companies can enable either their procurement or marketing/sales teams to both achieve a superior negotiating position as well as predict future revenues for given price adjustments. Given sufficient transactional data, e.g., on individual sales, this can not only be calculated on a per-product level, but also down to individual suppliers or sales regions.
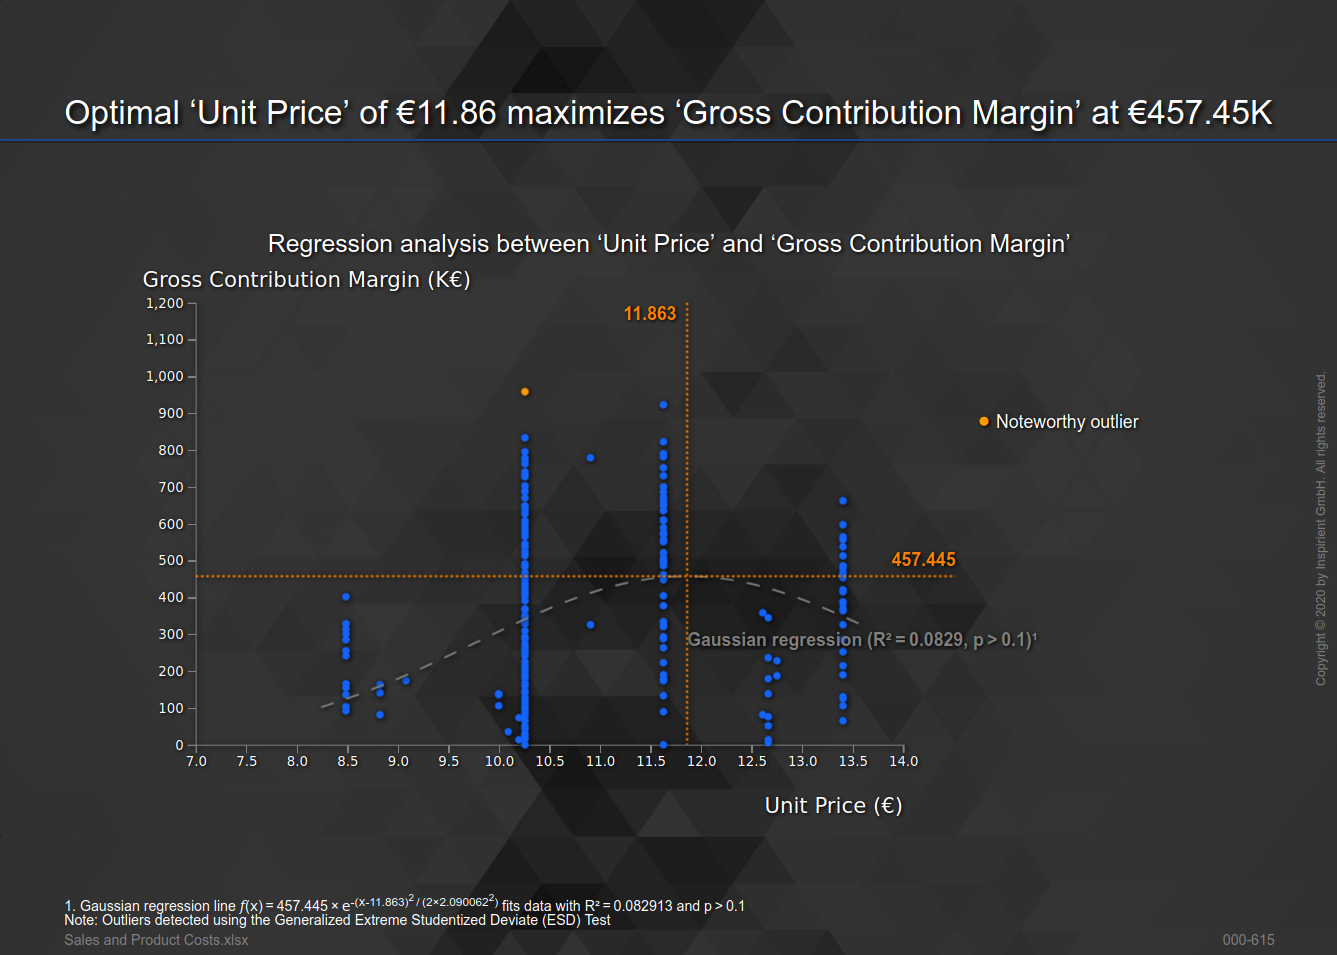
Beyond automatically modeling business metrics, this approach also allows businesses to fine-tune key levers to achieve specific, measurable objectives. To continue the example above, if the per-unit production or procurement cost is known, then the analysis can proceed to calculate both per-transaction and per-product contribution margins. Optimal curve fitting then once again allows to identify the optimal setting for the lever, given the target KPI, i.e., the optimal price point that maximizes the global contribution margin can be directly derived.
As with all analytical methods at Inspirient, optimal curve fitting is automated end-to-end. This allows businesses to apply this method at scale, e.g., across all products, regions, suppliers, and business units, and get up-to-date results as often as required.
The Inspirient Automated Analytics Engine automates the entire data analytics process end-to-end: From the assignment of input data, pattern and outlier detection, automated visualization of patterns, weak points and opportunities to automatic generation of textual explanations and recognition of the underlying relationships and rules. Most other analytics solutions rarely include these textual explanations and observations regarding the underlying data relations, which are both critical to provide a deeper level of analysis and more actionable conclusions.