Detect new trend patterns and prioritize action by taking into account their potential impact
Data-driven decisioning has never been so prominent – the right decision at the right time can both save lives and soften the economic blow caused by the current COVID-19 epidemic. There are many time series and map based analyses that focus on one indicator (for example over at the Financial Times) but for critical decision-making, multiple dimensions must be factored in.
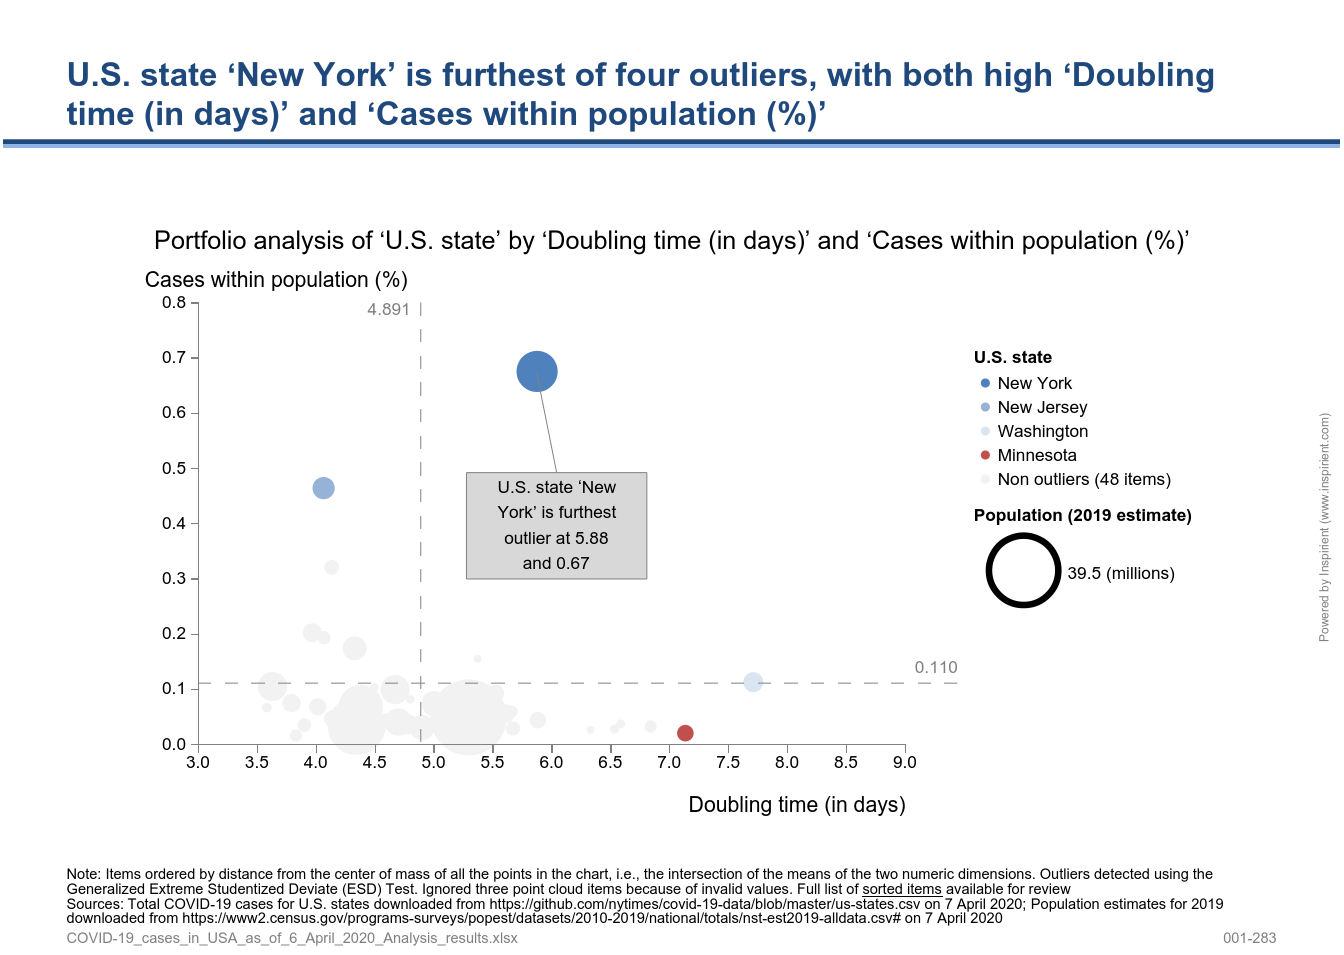
Business decision makers have been making data-driven critical business decisions for years with the use of the portfolio analysis, because it captures multiple factors in an easily interpretable format. Following on from our automated forecasting of cases in every German district for the WirVsVirus hackathon, we have applied the same analysis to the cumulative cases for all U.S. states and visualized the results as a portfolio analysis. (Source: New York Times)
New York seems to be furthest ahead, with relatively low spread rate and high proportion of cases, however, New Jersey seems most critical as the proportion of cases and the spread rate are both relatively high compared to the other states.
The Inspirient Automated Analytics Engine automates the entire data analytics process end-to-end: From the assignment of input data, pattern and outlier detection, automated visualization of patterns, weak points and opportunities to automatic generation of textual explanations and recognition of the underlying relationships and rules. Most other analytics solutions rarely include these textual explanations and observations regarding the underlying data relations, which are both critical to provide a deeper level of analysis and more actionable conclusions.