Inspirient’s user interface supports both desktop as well as mobile devices. Please use a recent version of a widely-used web browser such as Chrome, Edge, Safari or Firefox for an optimal experience.
The following sections have detailed explanations for each of the main steps of a typical analysis process.
Table of Contents
Uploading Files for Analysis
After logging in, users start an analysis by uploading the files they wish to analyze using the file submission dialog, as shown below.
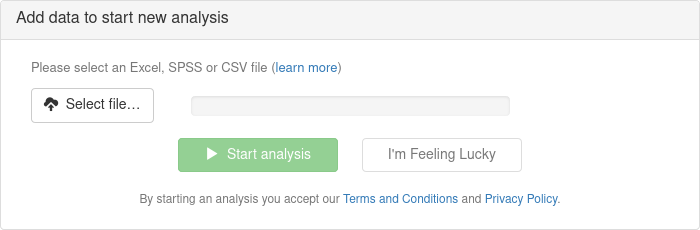
Supported file formats include the most widely-used formats for tabular data such as Microsoft Excel, IBM SPSS, and comma-separated values (CSV). Details of supported input file formats are listed in the table below.
| File Format | File Extension(s) | Reference |
|---|---|---|
| Microsoft Excel 97-2003 | XLS, XLT | Excel Binary File Format Structure |
| Microsoft Excel 2007 | XLSX, XLSM, XLSB, XLTX | Excel Extensions to the Office Open XML SpreadsheetML File Format |
| SPSS | SAV | IBM SPSS Statistics Data Files |
| Comma-Separated Values (CSV) | CSV, TSV | RFC 4180 and common variations |
Multiple files may be submitted for joint analysis, subject to the installation-specific setup.
Additionally, direct ingestion from on-site or Cloud-based relational databases is supported for database systems that provide an ODBC / JDBC interface. Oracle provides a list of supported database systems.
Once all files have been uploaded, users may select to start the analysis to have their data scanned and then review a proposed guidance for the analysis. Alternatively, users may click the I’m feeling lucky button to skip the guidance step and have their data analysed using the suggested guidance values without delay.
Providing Guidance
Guidance may be provided optionally to ensure that the automated interpretation of the input data is spot-on. All guidance parameters are pre-populated with automatically derived suggestions, given the system’s current understanding of the data. In most cases, these suggestions need only minimal corrections from the user. Also, the system learns over time which items were corrected by the user, in order to steadily improve the suggestions it provides.
There are three steps to providing guidance for an analysis: Selecting which tables to analyze, prioritizing the dimensions (i.e., columns) of these tables, and providing additional context via annotations. Furthermore, advanced settings are available to support advanced users.
Selecting Tables
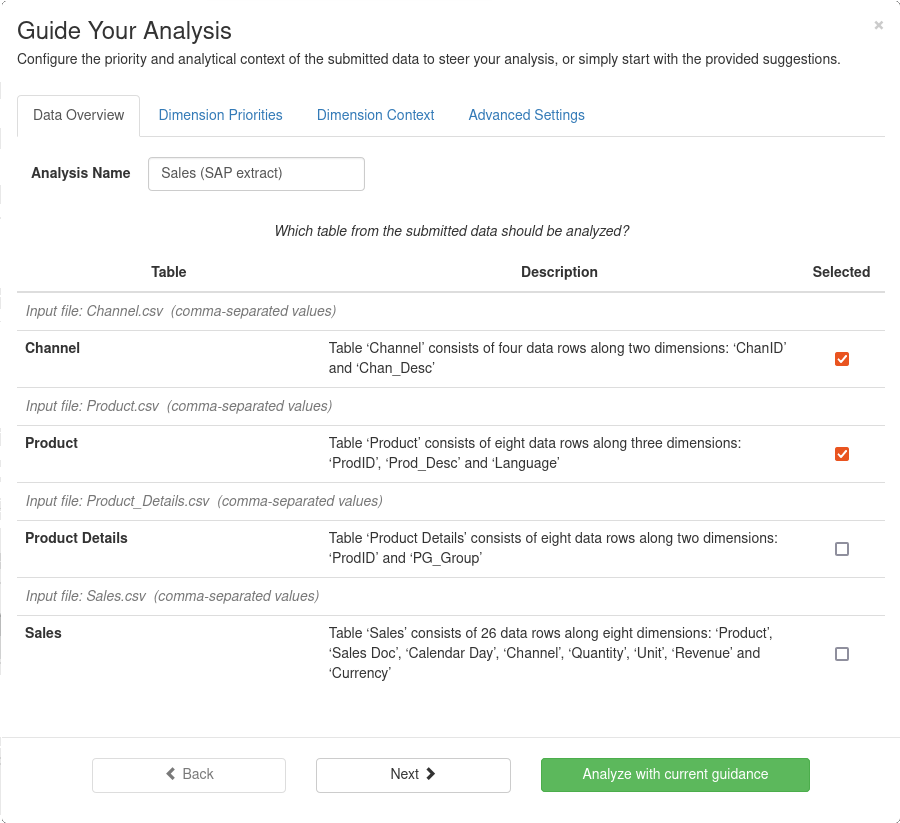
One or more tables from the input files may be selected for analysis in this step.
The overview of which tables are available also serves as a quick way to check whether all the tables have been correctly identified, especially, for file formats that allow for flexible layout of data, e.g., Microsoft Excel.
Prioritizing Dimensions
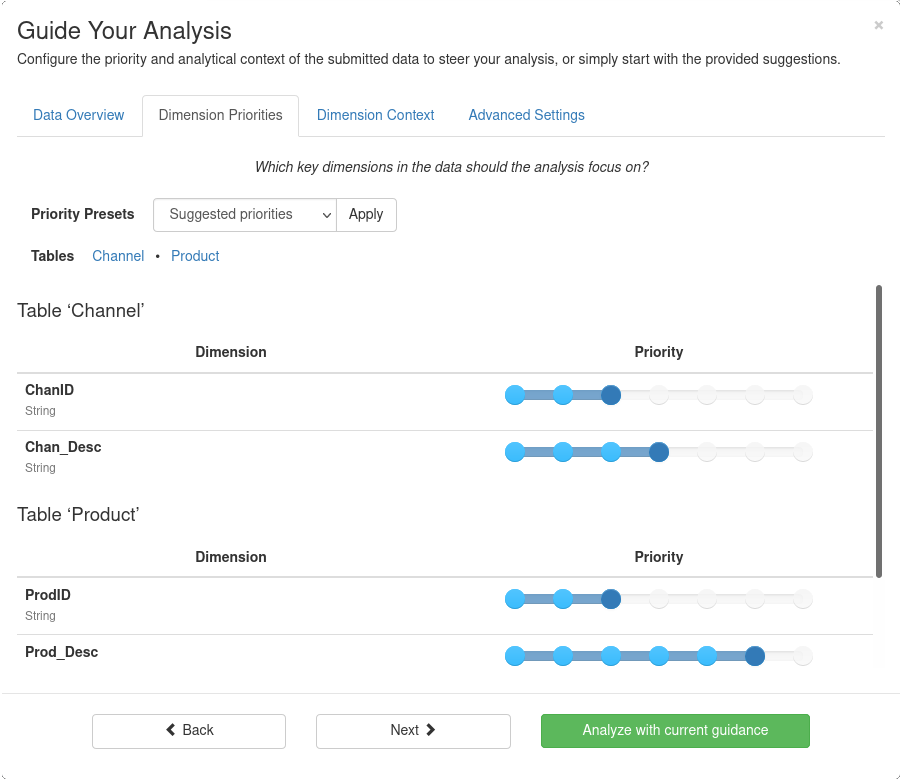
Dimensions (i.e., columns) of selected tables to be prioritised using the sliders in this dialog. The priority of a dimension has two effects:
- Results based on higher priority dimensions are shown more prominently to the user
- Higher priority dimensions take precedence when being considered for an analysis method that would exceed the available computational and storage resources
As a special case, dimensions with the lowest priority setting are ignored during the analysis, which allows users to speed up the more focussed analysis, without having to edit the input data.
Contextualizing Dimensions with Annotations
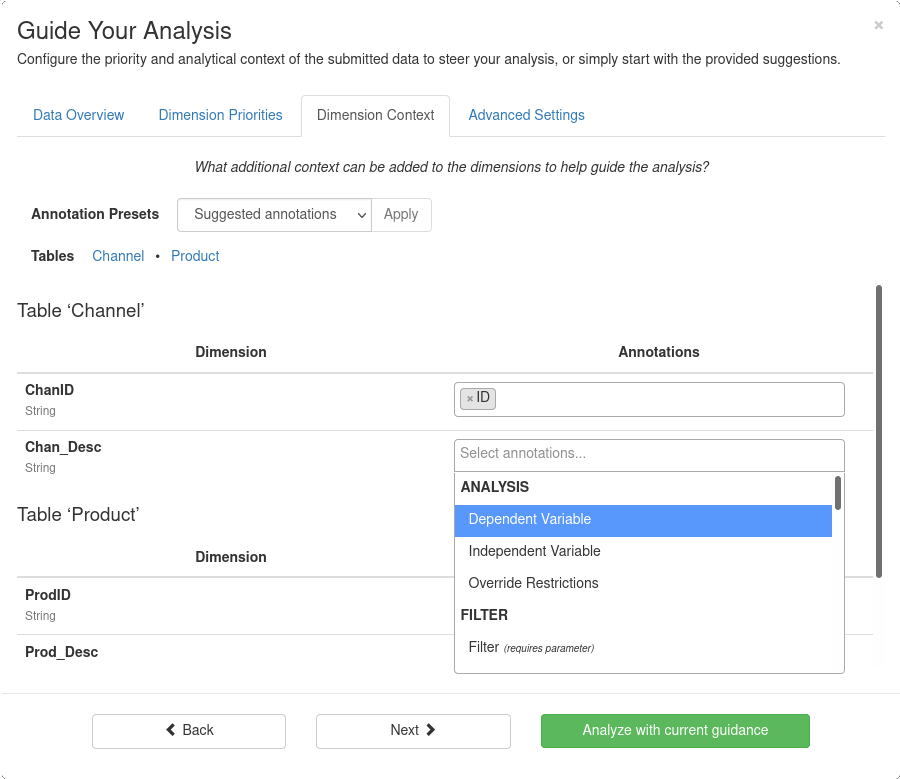
Annotations are used to provide additional context to the analysis that cannot be established from the data alone. For example, for a dimension that contains prices in a currency format, it can be ambiguous whether it makes sense to calculate the sum of these prices: If the table is about sales transactions, the sum of prices is the revenue and as such both valid and relevant. However, if the table is a product inventory or SKU list, then the sum of prices is meaningless. To establish this context, the dimension can thus be annotated with either SUMMABLE or NOT SUMMABLE, or left blank to allow the system to decide.
Inspirient supports a number of data annotations that enable users to manipulate the input data, establish prerequisites for statistical methods, and ensure a use-case-specific handling of certain dimensions. A comprehensive list of all supported data annotations can be found in Data Priorities and Annotations.
Both dimension priorities and annotations are pre-populated by the system based on prior analyses and, as a fallback, using heuristics that look at, e.g., column labels and data types and formats. In most cases, any particular kind of dataset only needs to be prioritized and annotated once, and then all similar datasets will reuse this information.
Browsing the Results
When the system completes an analysis, the user is presented with an overview of results in the form of multiple short presentations (so-called ‘stories’). Interactive browsing of results is supported via different view modes, tag-based and textual search, as well as contextual recommendations for which results to look at.
The stories address different analytical needs that a user may have, including topics such as…
- Understanding the quality of a dataset, incl. the impact of inconsistencies
- Needing a quick overview of the key dimensions and their properties
- Scanning the dataset for unknown patterns and anomalies
Stories can be viewed as full presentations, with the option to download as a PDF file, or on a slide-by-slide basis. In many cases, stories include pointers to additional results which can be browsed via the web-based interface.
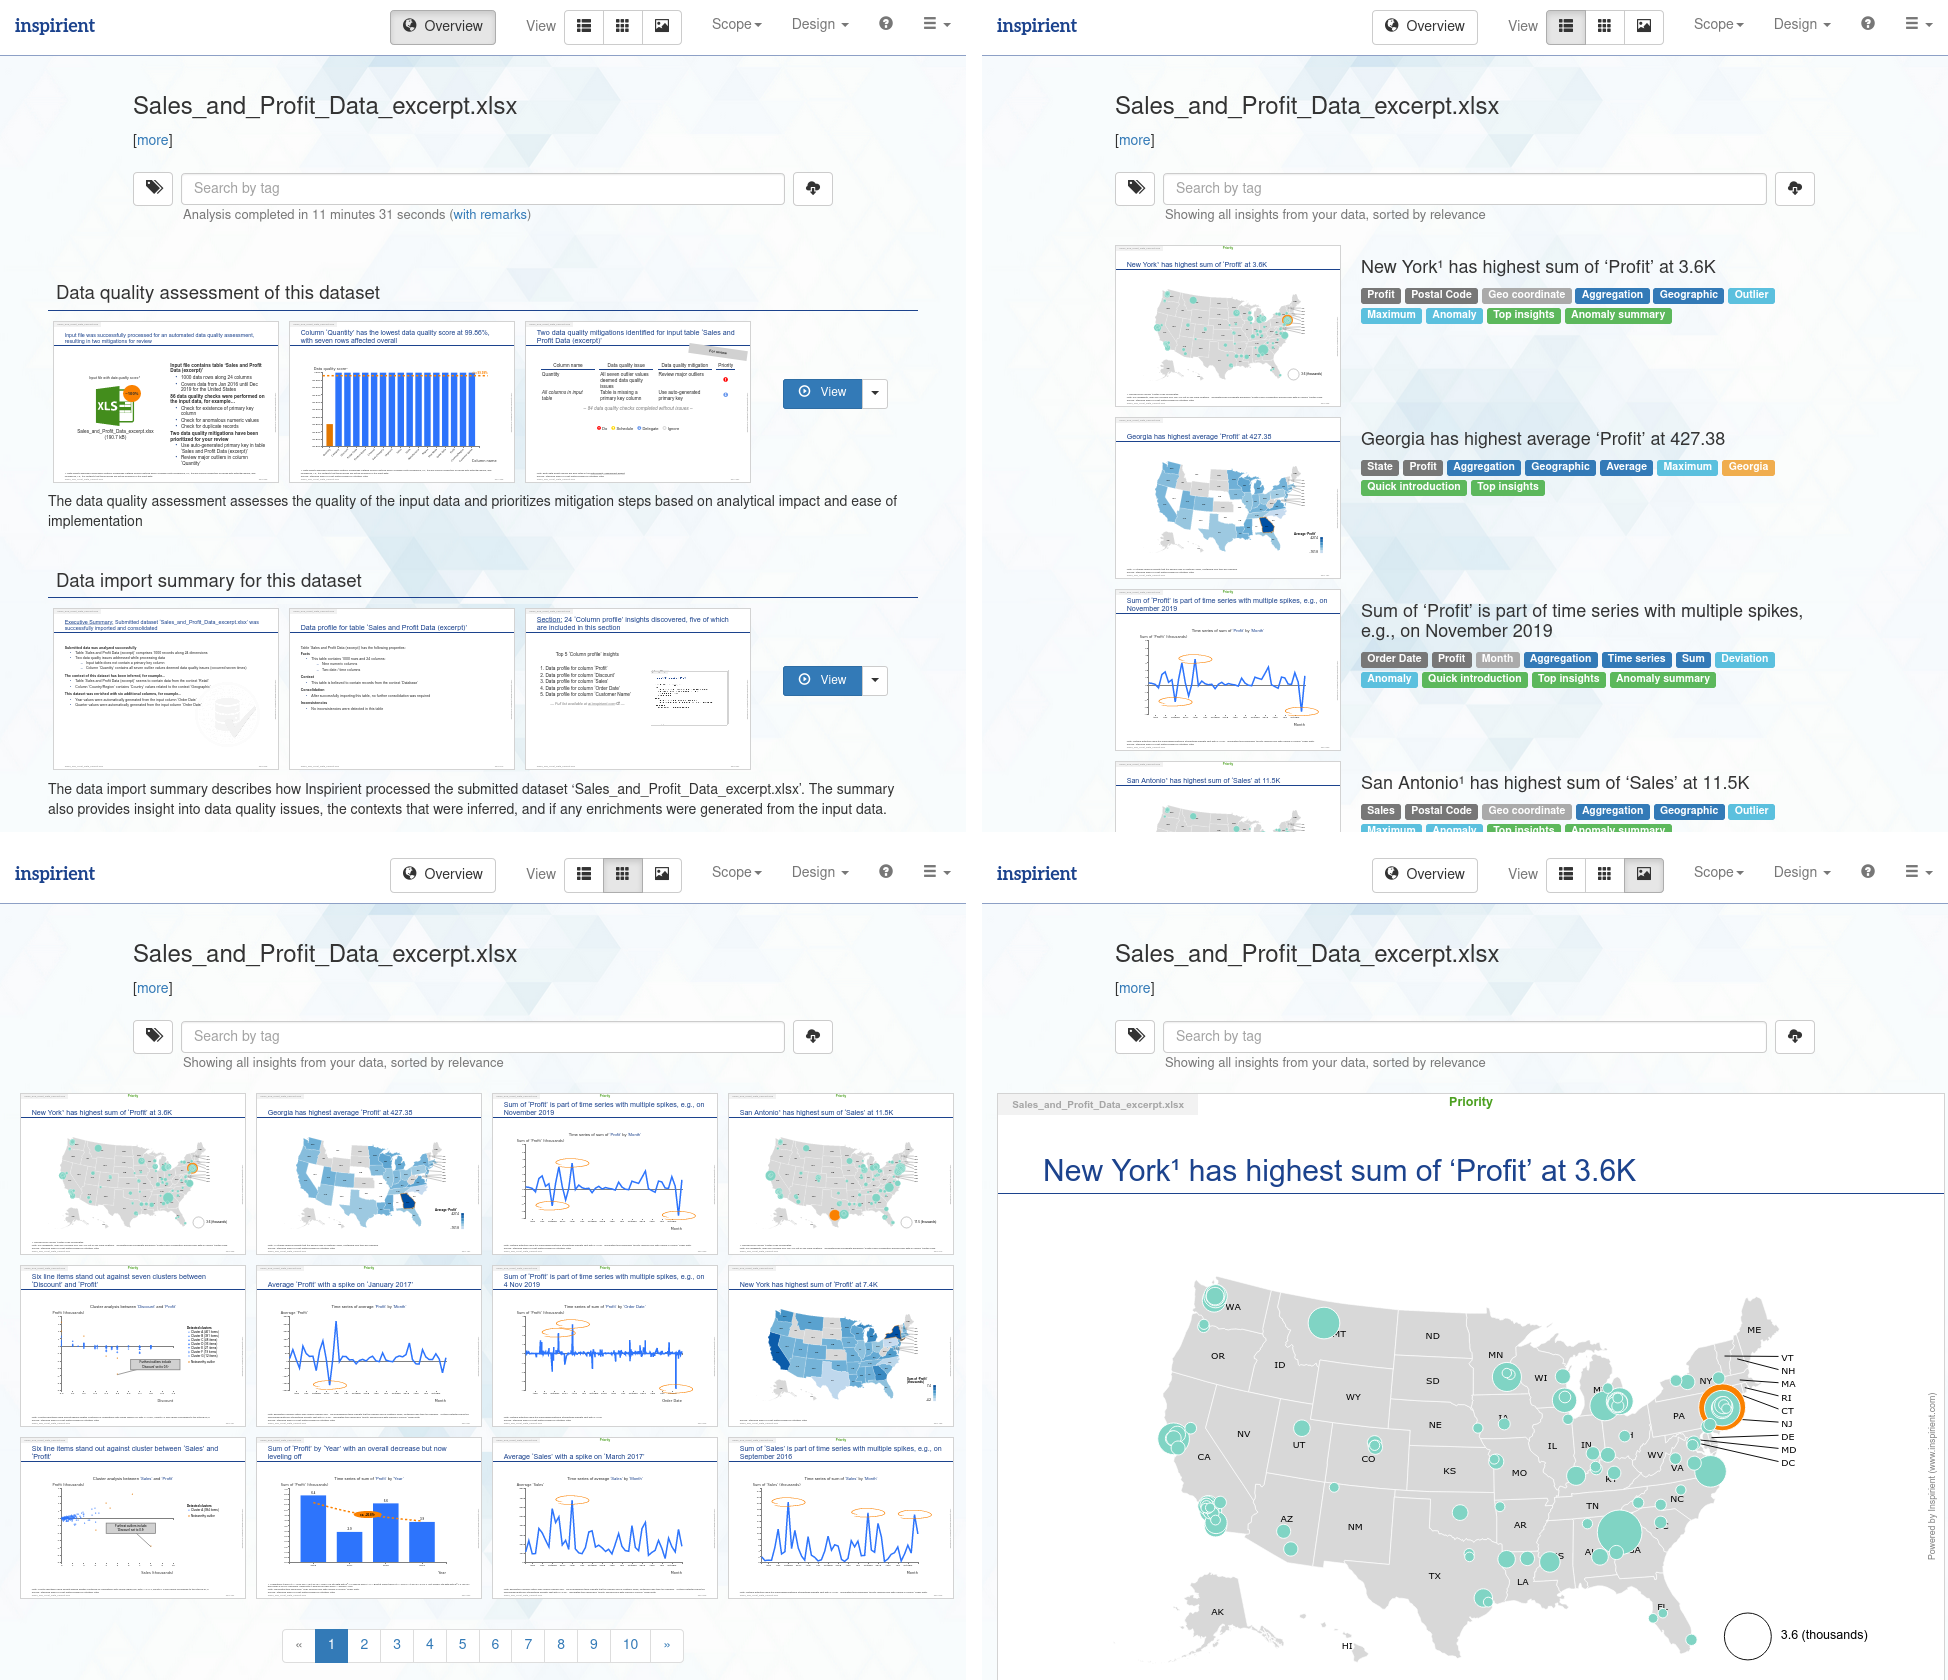
Three additional view modes allow browsing individual results: List view emphasizes the textual description of a result, grid view allows for quick visual consumption, and presentation view enables a look at the details. On mobile devices with smaller screens, only presentation view is available.
In all view modes, users may at all times use the search field to look for specific results, either by input dimension, analytical method used, or pattern detected. These search options work by utilizing the tags Inspirient applies to all results. These tags are detailed in Using Tags to Navigate Results.

Results may be sorted in one of three ways:
- by suggested overall relevance – a combination of the two metrics below (default)
- by specified input priority – the per-dimension priority setting provided during the guidance step (or the system-suggested priority if the user skipped the guidance step)
- by pattern relevance – the statistical significance of the patterns detected across all input dimensions, normalized and weighted by a multiplier specific to each type of pattern
For each result, additional information and options become available by clicking on it. Results can be viewed in full screen and downloaded in various formats. Also, it is possible to provide positive or negative feedback to each result (see Providing Feedback), to share a result with other users, and to inspect which detailed reasoning steps were applied in which sequence to yield a given result.
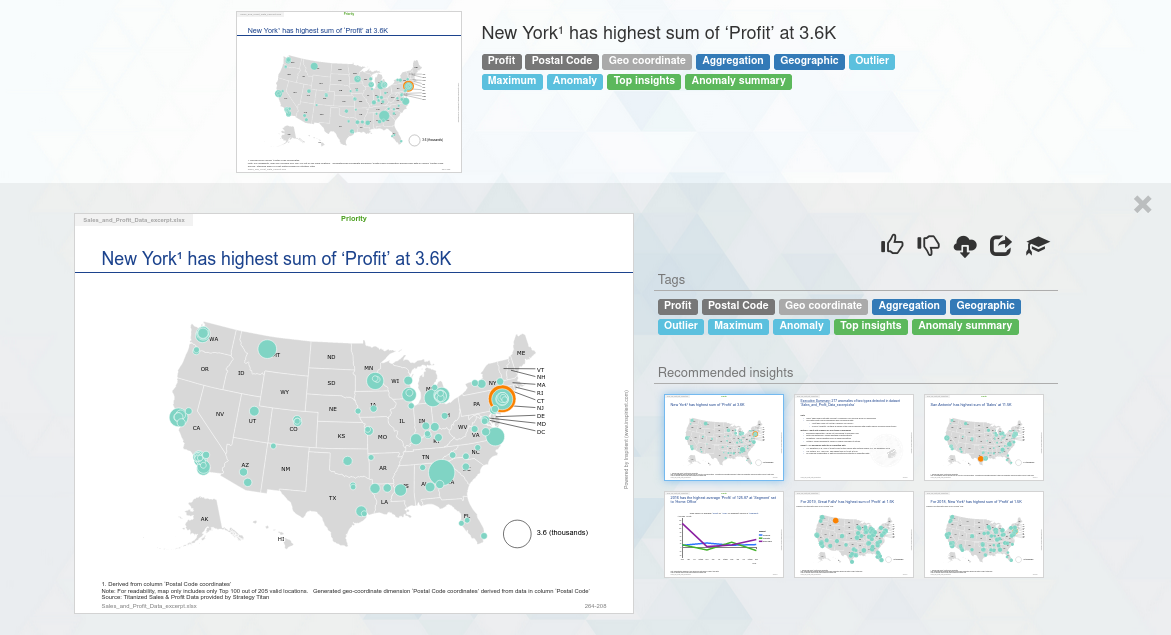
Finally, for each result a set of recommendations are shown to guide the user to potentially relevant complementary results. Recommendations are selected based on semantic proximity of other results via comparison of their tags, and by evaluating prior user feedback to the system in the current and other analyses.
Providing Feedback
Users can provide both positive and negative feedback to each result using the thumps up and thump down buttons in the detail view of each result:
- Positive feedback increases the likelihood of similar results appearing as suggestions in the detail view, and is also visible to other users. This means that users may easily browse exactly those results that were ‘liked’ by other users, thereby enabling teams to jointly review the results of an analysis.
- Negative feedback reduces the likelihood of similar results appearing as suggestions, but it does not remove these results from the overall result set – just in case another user disagrees.
Feedback is stored and processed globally for each client-specific tenant, thus enabling all client teams to profit from each other’s feedback, while keeping the learnings private to each company.
Downloading Generated Output
In addition to visualized results as presentation slides, analytical output is also available in various other forms, e.g., as analytically enriched datasets. Users may download these items in the Download Center that is accessible via the button right of the search field.
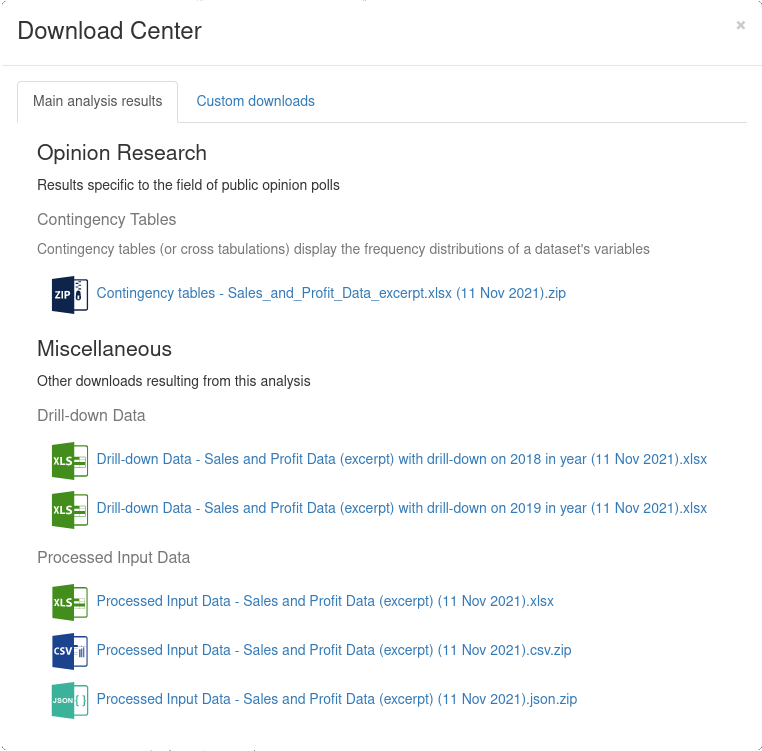
The Download Center has areas for both pre-calculated items of key analyses as well as subsets of results selected by the user. Pre-calculated items are both general in nature, e.g., the harmonized input data after applying all data cleaning and enrichment methods, and specific to use cases, e.g., the set of all contingency tables for an analysis of survey data.
Managing and Sharing Analyses
Current and past analyses may be managed via the Recent Analyses list that is available via the top-right menu. Long-running analyses may be aborted while they are underway to free up compute resources for other analyses, and existing analyses may be removed if their results are no longer required.
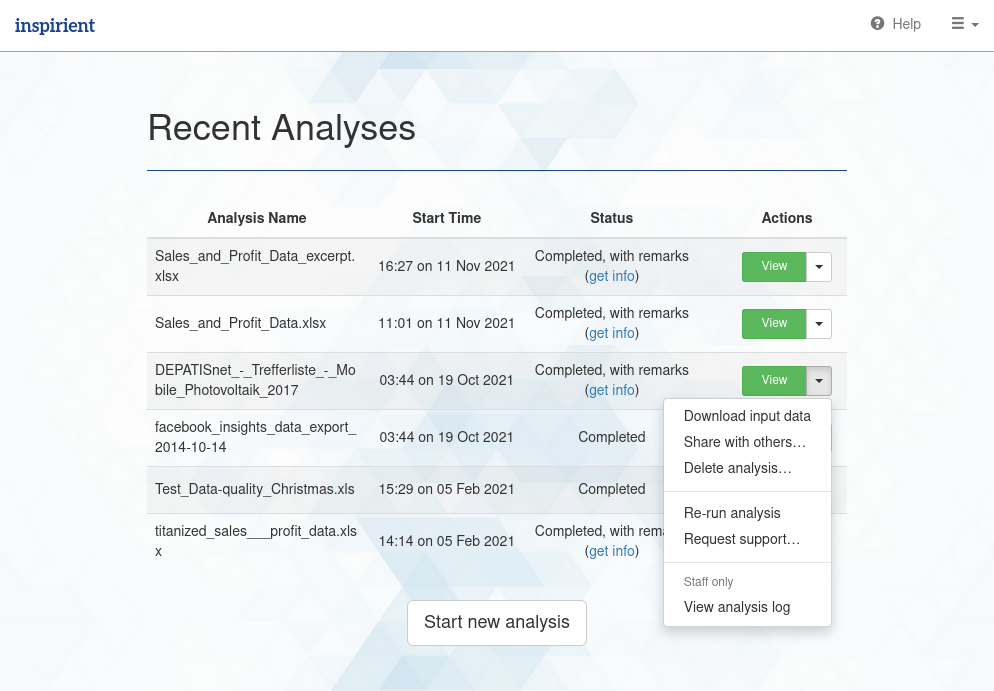
User may also use the Recent Analyses list to share individual analyses with other users from the same organisation, or, if enabled, to share analyses publically (disabled by default). Shared analyses become part of the Recent Analyses list of each user with whom an analysis has been shared. These users may view the results, and provide positive and negative feedback. Since positive feedback is visible to all users with access to an analysis via the ‘Liked’ tag, sharing analyses with a team allows feedback and opinions to be gathered quickly about which results matter the most.