Prioritizing and annotating the dimensions of input data is part of the optional guidance step for each analysis, as introduced in Working with Inspirient > Providing Guidance. For both dimension priorities and annotations, suggested values are provided by the system based on its current understanding of the dataset. In most cases, users only need to review and possibly tweak these suggestions. If an analysis is started via the I’m feeling lucky button, all suggestions are used directly without reconfirming them with the user.
Prioritization of Input Dimensions
Prioritization affects the sorting order of results, so that results that are derived from higher-priority dimensions are more prominently displayed among results and more likely to be included in stories.
The exact effects of low / high priorities are as follows, with the objective of ensuring that overall comprehensiveness across all analytical methods degrades gracefully for very large datasets:
- Dimensions set to the lowest priority setting are ignored during the analysis
- Dimensions set to the highest priority setting are analysed preferentially, i.e., they are guaranteed to be evaluated by all applicable analytical methods
- Other low-priority dimensions may be omitted from certain analytical methods if otherwise computational requirements would exceed allocated resources.
Client-specific and hardware-specific options may be set by system administrators to fine-tune system behavior.
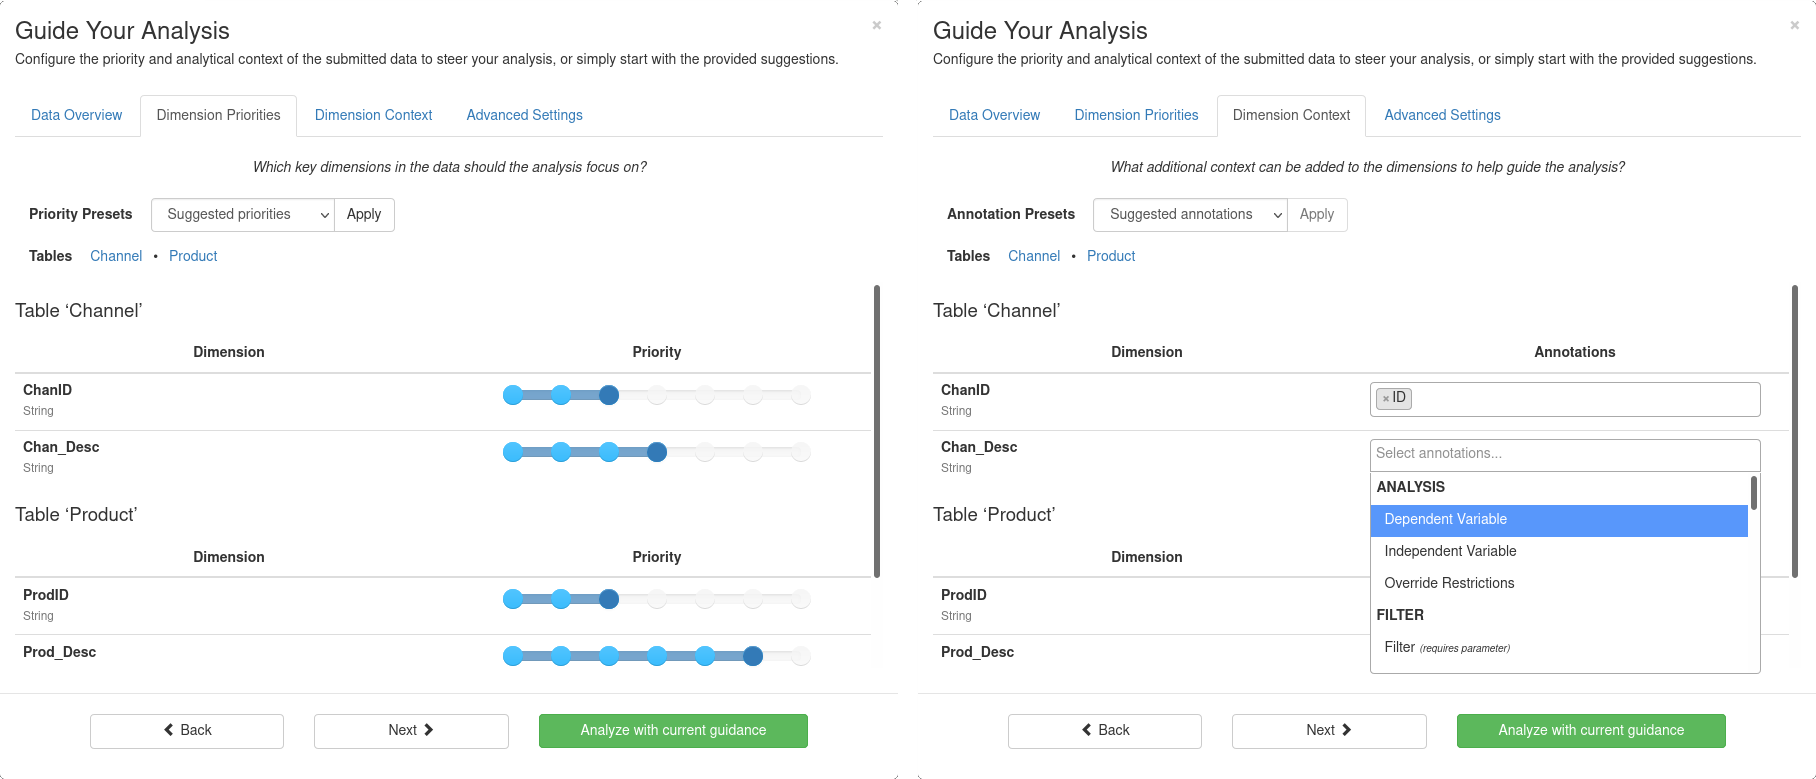
Contextualization of Input Dimensions
Annotations allow users to establish the analytical context of input dimensions, for example, to specify whether calculating the sum over a column of numeric values is sensible (e.g., for inventory quantities) or not (e.g., for time-series measurements).
Effects of annotations are additive if multiple annotation are applied to the same column of a datatset. In case the effects of multiple annotations are mutually exclusive, the annotation that is applied later overrules any preceding annotations.
There are four kinds of data annotations:
- Filter – Annotations that perform various filters on the input data
- Transformation – Annotations used to carry out a transformation on the input values
- Semantic – Annotations to explicitly communicate column meaning
- Analysis – Annotations that affect the analysis
Some annotations also have a general negated version that causes the stated effect of the annotation not to be applied or considered when evaluating the dataset. For the negated version, the prefix NOT_ (including the trailing underscore character) is prepended to the regular annotation. For example, the annotation SUMMABLE becomes NOT_SUMMABLE in its negated form. Annotations that support this form of general negation are marked with (N) in their type fields below.
The full list of supported annotations and their effects are listed in the following tables.
| Annotation | Type | Description | Examples |
|---|---|---|---|
DEFAULT_VALUE |
Transformation | Specifies a default value for this column that is used whenever a value is not given, i.e., it is absent or given as ‘null’. |
|
IGNORE_VALUE |
Transformation | Ignore specified value(s), i.e., treat as absent or null |
|
MORE_IS_BETTER |
Semantic | Specifies that higher values in a numeric columns are ‘better’ in the context of this analysis, i.e., for any optimization sets the aim to achieve higher values for this dimension (as opposed to lower values). See also LESS_IS_BETTER. |
|
LESS_IS_BETTER |
Semantic | Specifies that lower values in a numeric column are ‘better’ in the context of this analysis, i.e., for any optimization sets the aim to achieve lower values for this dimension (as opposed to higher values). See also MORE_IS_BETTER. |
|
HAS_SUBTOTALS |
Semantic | Specifies that a numeric column contains subtotals, which implies that certain analyses are not permissible for this column, e.g., calculating sums and averages over all values (or even selections of values that still include the subtotals). |
|
ID |
Semantic | Specifies that numeric values in a column represent ID values that can be used for aggregating other numeric values or joining data from another table, but should not be summed or averaged. |
|
NATURAL_LANGUAGE_TEXT |
Semantic | Text values in this column should be treated as natural language text for semantic text analysis. |
|
| Annotation | Type | Description | Examples |
|---|---|---|---|
NOMINAL |
Semantic (N) | Ensures numeric values in this column are treated as (unordered) categorical items, i.e., they will only be counted when aggregated and not summed or averaged. See also ORDINAL. |
|
CATEGORICAL |
Semantic | Synonymous with NOMINAL. |
(as above) |
ORDINAL |
Semantic (N) | Ensures values in this column are treated as ordered categorical items, i.e.., allowing them to be counted in aggregations and sorted in the correct order. See also NOMINAL. |
|
SUMMABLE |
Semantic (N) | Specifies that it is OK to sum the numerical values in this column. |
|
MAXIMIZABLE |
Semantic | Specifies that the values in a numeric column have a meaningful maximum which should be considered in all analyses. See also MINIMIZABLE. |
|
MINIMIZABLE |
Semantic | Specifies that the values in a numeric column have a meaningful minimum which should be considered in all analyses. See also MAXIMIZABLE. |
|
| Annotation | Type | Description | Examples |
|---|---|---|---|
DEPENDENT_VARIABLE |
Analysis | Specifies that this column is a dependent variable of interest that should be explained given information in other independent variables. See also INDEPENDENT_VARIABLE. |
|
INDEPENDENT_VARIABLE |
Analysis | Specifies that this column is a control variable that can be used to explain effects on the dependent variable(s) in the same table. See also DEPENDENT_VARIABLE. |
|
REFERENCE_CATEGORY |
Semantic | For multivariate regression analysis, this annotation specifies the category value (as the parameter of this annotation) that is used as the baseline reference to compare against all other categorical values of a column. |
|
WEIGHTING_FACTOR |
Analysis | In survey analytics, this annotation specifies that the values in this dimension should be used to weight aggregations, typically with the objective of compensating for bias in the collected data. |
|
| Annotation | Type | Description | Examples |
|---|---|---|---|
ABC_CLASSIFICATION |
Transformation | Classify column into n categories using ABC analysis. | |
FILTER_ON |
Filter | Filter table so that only rows are processed that match a given criteria. Criteria may be specified as values for direct comparison or as regular expression for text, or comparison operators for numbers. Filters applied to multiple columns are additive, just like drop-down filters, e.g., from Microsoft Excel. Active filters are noted in the Analysis Context of each result they affect. |
|
FILTER_ON_DOMINANT_DOMAIN |
Filter | Filter table on the most frequent items within a column, i.e., those categorical items that in combination account for at least 80% of the contents of the column. This annotation is used to focus the analysis on the most relevant categories, and omit noise created by a “long tail”. |
|
FILTER_ON_DOMINANT_DOMAIN_BY_VALUE |
Filter | Filter table on items of a numerical column which together, with smallest count of items, amount to at least 80% of the total accumulated value of a column. Not defined if column contains both positive and negative values. |
|
FILTER_ON_TOP_3_BY_VALUE |
Filter | Filter table on the three items with the largest sum of a given numeric value column. |
|
FILTER_ON_TOP_10_BY_VALUE |
Filter | Filter table on the ten items with the largest sum of a given value column. |
|
DRILL_DOWN |
Transformation | Split table into separate tables for each unique value in this column. Each of these tables is then analyzed separately. The drill-down value is specified in the Analysis Context of each result. Use with caution, as this annotation will very likely lead to a much larger number of results. See also DRILL_DOWN_ON_DOMINANT_ DOMAIN. |
|
DRILL_DOWN_ON_DOMINANT_DOMAIN |
Transformation | Split table into separate tables for the most frequent items in this column, i.e., those items that collectively account for 80% of all data in this column. Each of these tables is then analyzed separately. The drill-down value is specified in the Analysis Context of each result. Use with caution, as this annotation will likely lead to an increase in the number of results. See also DRILL_DOWN. |
|
JOINABLE_ID_VALUES |
Transformation | Join this table and a second table that is also being submitted for analysis using the values in this column as primary / foreign keys. The column with unique values is treated as primary key. If both columns have non-unique, i.e., repeating, values, no action is taken. |
|
JOINABLE |
Transformation | Synonymous with JOINABLE_ID_VALUES. |
(as above) |
USE_AS_IS |
Transformation | Disables any automated transformations during analysis for this column, e.g., any automated attempts of cleaning up erratic and/or outlier values or of converting the data in this column to a more suitable data type for analysis. |
|
| Annotation | Type | Description | Examples |
|---|---|---|---|
PROCESS_VARIABLE |
Semantic | For process data, specifies that a column contains process-level data, i.e., data relating to the abstract definition of a business process. |
|
PROCESS_ID |
Semantic | For process data, specifies that a column contains ID values that correspond to a uniquely identifiable, abstract business process. |
|
INSTANCE_VARIABLE |
Semantic | For process data, specifies that a column contains instance-level data, i.e., data relating to a specific execution instance of a business process. |
|
INSTANCE_ID |
Semantic | For process data, specifies that a column contains ID values that correspond to a uniquely identifiable, specific execution instance of a business process. |
|
EVENT_VARIABLE |
Semantic | For process data, specifies that a column contains event-level data, i.e., data relating to a specific event as part of the execution instance of a business process. |
|
EVENT_ID |
Semantic | For process data, specifies that a column contains ID values that correspond to a uniquely identifiable, specific event as part of an execution instance of a business process. See also EVENT_CATEGORY. |
|
NEXT_EVENT_ID |
Semantic | For process data, specifies that a column contains ID values that correspond to the subsequent event within the same instance along a process. See also EVENT_ID. |
|
PREVIOUS_EVENT_ID |
Semantic | For process data, specifies that a column contains ID values that correspond to the prior event within the same instance along a process. See also EVENT_ID. |
|
EVENT_CATEGORY |
Semantic | For process data, specifies that a column contains categories that allow classifying and aggregating per-event process data. See also EVENT_ID. |
|
EVENT_START_TIMESTAMP |
Semantic | For process data, specifies that a column contains the start time of an event. See also EVENT_END_TIMESTAMP and EVENT_DURATION. |
|
EVENT_END_ TIMESTAMP |
Semantic | For process data, specifies that a column contains the end time of an event. See also EVENT_START_TIMESTAMP and EVENT_DURATION. |
|
EVENT_DURATION |
Semantic | For process data, specifies that a column contains the duration of an event. See also EVENT_START_TIMESTAMP and EVENT_END_TIMESTAMP. |
|
EVENT_RESULT |
Semantic | For process data, specifies that a column describes the result state of an event. |
|
EVENT_OWNER |
Semantic | For process data, specifies that a column contains owner information relating to an event. |
|
| Annotation | Type | Description | Examples |
|---|---|---|---|
DEFINE_AS_MISSING |
Transformation | Specifies a value for this column that is to be treated as missing, i.e., no data available, during survey analysis. |
|
DEFINE_AS_NO_OPINION |
Transformation | Specifies a value for this column that is to be treated as ‘no opinion’, i.e., respondent decided to provide no answer, during survey analysis. |
|
DEMOGRAPHIC_VARIABLE |
Semantic | For survey analytics, specifies that a column contains socio-demographic information which can be used in contingency tables and cross tabulations. Together with SURVEY_RESPONSE and SURVEY_META, this annotation classifies all dimensions contained in a typical survey dataset. See also SURVEY_RESPONSE and SURVEY_META. |
|
MULTIPLE_RESPONSE_VARIABLE |
Semantic | In survey analytics, if responses to multiple choice questions are stored across one dimension per response option, this annotation specifies which dimensions jointly encode a multiple choice variable. The annotation takes the name of a multiple choice variable (or any other string) as parameter, and this parameter needs to be identical across all dimensions belonging to the multiple choice variable. |
|
MULTI_PUNCH_VARIABLE |
Semantic | Synonymous with MULTIPLE_RESPONSE_VARIABLE |
(as above) |
SURVEY_CASE_ID |
Semantic | In survey analytics, specifies that this column stores ID values that uniquely identify the case / interview / questionnaire / respondent. |
|
SURVEY_DURATION |
Semantic | In survey analytics, this annotation specifies that this dimension holds the duration that a participant used to complete the interview or questionnaire. Adding this annotation enables speeder detection as part of the survey quality assessment. |
|
SURVEY_INTERVIEWER |
Semantic | In survey analytics, specifies that this column stores values that uniquely identify the interviewer who conducted the interview with a participant. Adding this annotation enables checks for interviewer bias as part of the survey quality assessment. |
|
SURVEY_META |
Semantic | In survey analytics, this annotation should be applied to any dimension that holds meta-information about the survey to be analyzed, e.g., internal identifiers, organizational data or instructions to the interviewer or interview software. Together with DEMOGRAPHIC_VARIABLE and SURVEY_RESPONSE, this annotation classifies all dimensions contained in a typical survey dataset with the effect that no warnings are shown regarding any unclassified dimensions. See also DEMOGRAPHIC_VARIABLE and SURVEY_RESPONSE. |
|
SURVEY_MODE |
Semantic | In survey analytics, specifies that this column stores values that uniquely identify the survey mode as part of which this case / interview was collected. |
|
SURVEY_RESPONSE |
Semantic | In survey analytics, this annotation specifies that a dimension contains survey response values which can be used in contingency tables and cross tabulations. Together with DEMOGRAPHIC_VARIABLE and SURVEY_META, this annotation classifies all dimensions contained in a typical survey dataset. See also DEMOGRAPHIC_VARIABLE and SURVEY_META. |
|
SURVEY_WAVE |
Semantic | In survey analytics, specifies that this column stores values that uniquely identify the survey wave as part of which this case / interview was collected. Adding this annotation enables analysis of how responses have changed over time. |
|
| Annotation | Type | Description | Examples |
|---|---|---|---|
ANONYMIZE |
Transformation | Anonymize all values in column with a securely generated ID value, utilizing a cryptographically strong one-way hash function. A look-up table to map hashed values to original values is made available separately to the user who owns the analysis. |
|
OVERRIDE_RESTRICTIONS |
Analysis | Annotates a dimension to be analyzed without any restrictions that would usually be in place to ensure acceptable runtime when analyzing very large tables. Use with caution! |
These annotations are compliant with DIN SPEC 32792.
Advanced users may also prefer to embed these annotations directly in their data, by appending them to column labels enclosed in curly brackets, e.g., {SUMMABLE}.
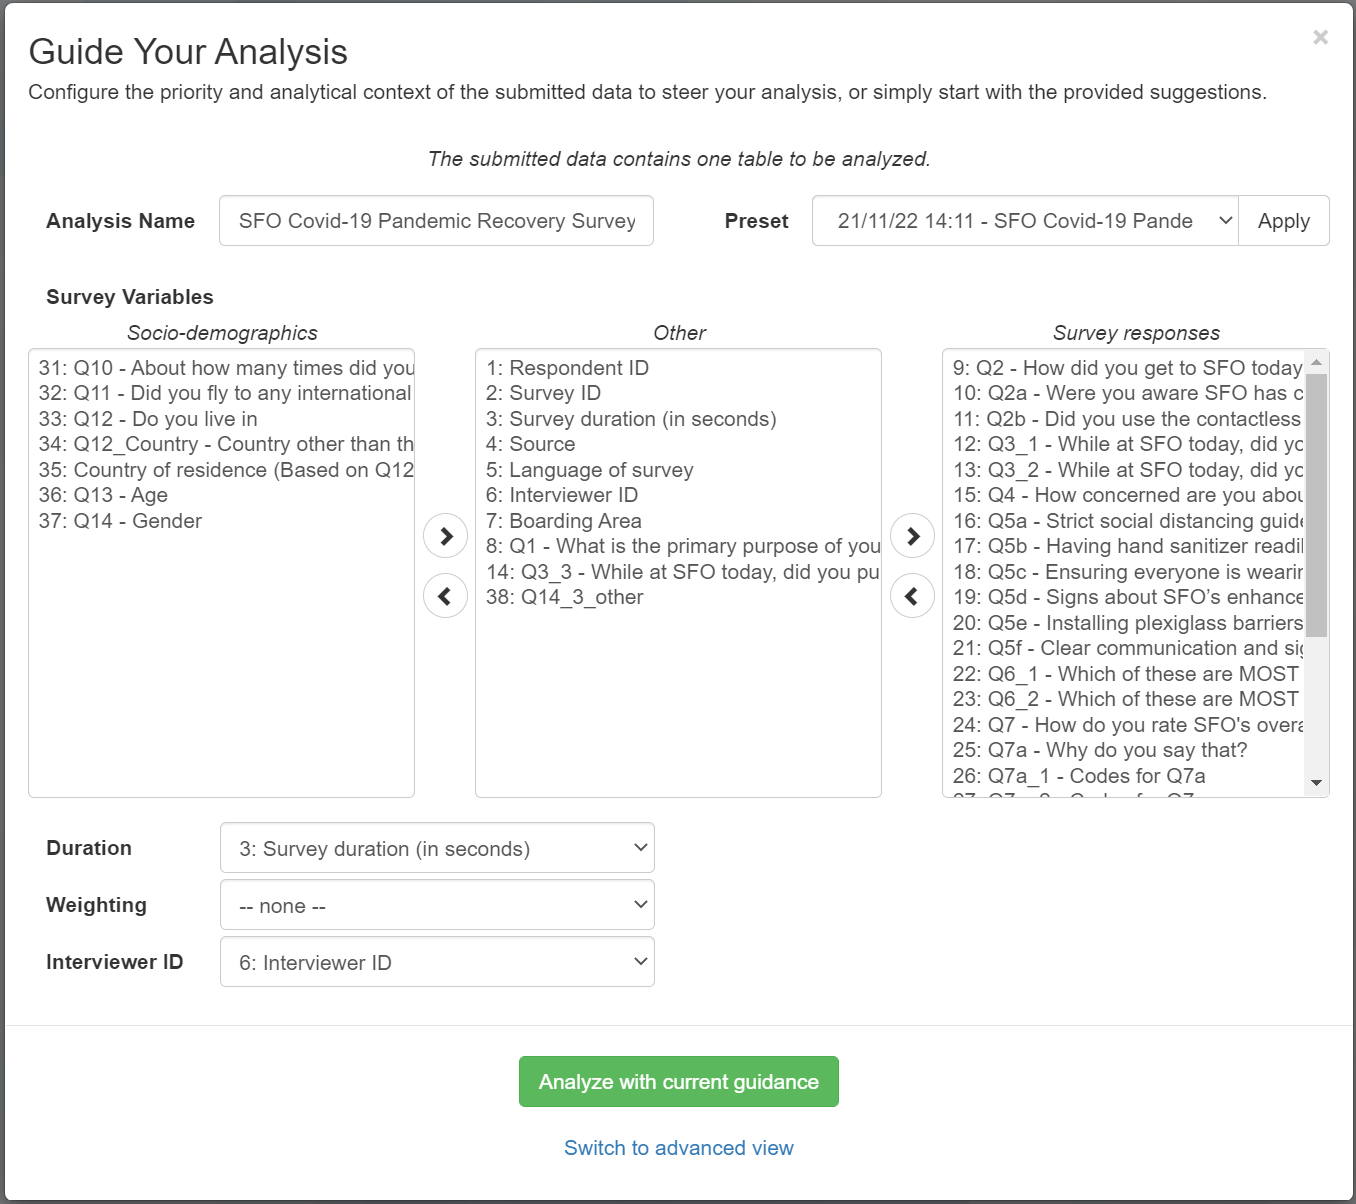
Simple Analysis Guidance (Survey Analysis)
With the Analysis Guidance, as described above, users have great control over the performed analysis. This much control, on the other hand, may be time consuming and not necessary for some users.
Therefore Inspirient offers a more simple guidance additionally, which is tailored specifically to survey analysis. For most cases, that will give users enough control to guide the analysis with minimal time effort.
Initially the user will be shown a system-made classification of the input data’s columns. Afterwards the user may adjust the classification as pleased, by either using the multi-select or dropdown-menus and the according buttons.
The Simple Analysis Guidance (Survey Analysis) is automatically shown for all survey analyses. If more fine granular control is desired, a click to “Switch to advanced view” takes the user to the Analysis Guidance.
Best Practices
- Prioritize sparingly, but with confidence – In most cases, it is not necessary to fine-tune the priorities of every dimension of a dataset. It’s more time-efficient to quickly adjust the priorities of the most important dimensions, and then later use tags to filter out less important results.
- Annotate selectively – Annotations help the system to correctly handle the dimensions of a dataset in all corner cases. This means that in most cases the correct analytical methods will be applied, even without annotations. If pressed on time, some users may even do a quick initial run with the I’m feeling lucky button, check key results for issues, and add only annotations required to address these issues.
- Re-use prior priorities and annotations – Priorities and annotations of all past analyses are scanned to make the best possible suggestion for the current dataset. This includes datasets from other users (with accounts on the same Inspirient service instance). Suggested priorities and annotations may thus reflect what your co-workers may find appropriate for your data at hand.