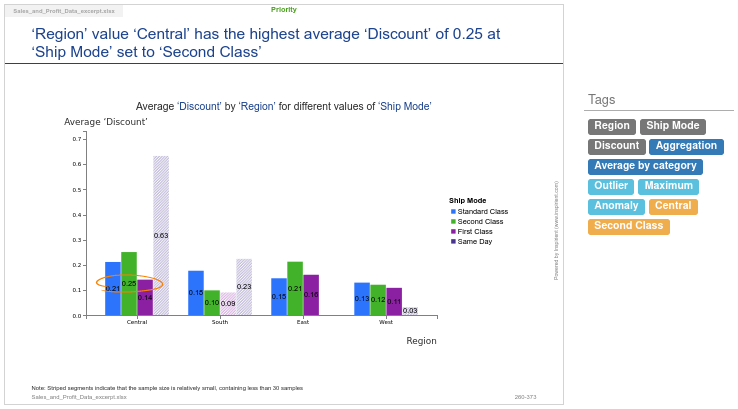
Tags are pieces of meta-information the Inspirient Automated Analytics Engine adds to every result it derives from a dataset. Tags specify exactly which dimensions of the dataset a result is based on, by which method it was derived, and which patterns were identified, among other things. The primary purpose of tags is to support navigating the results, e.g., users may look for any results tagged as being based on a dimension like ‘Profitability’ (a source dimension tag) and having a trend (a pattern tag).
Types of Tags
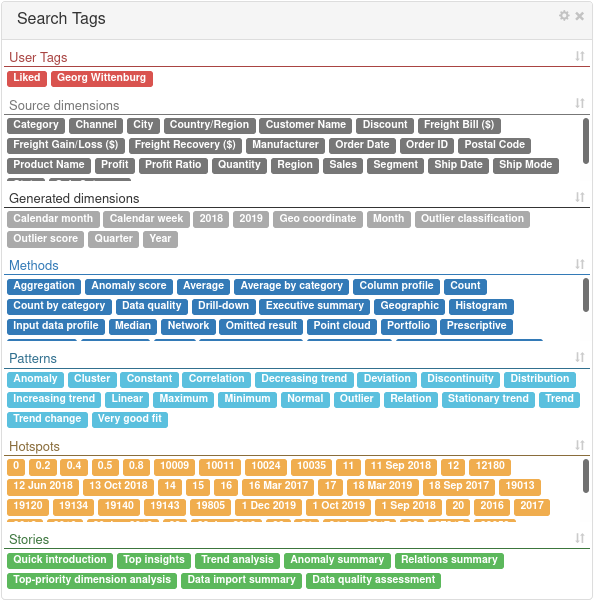
Similar tags are grouped by type, with seven different types of tags in total:
- User tags – Tags added to results that a user gave positive feedback on, i.e., liked
- Source dimensions tags – Tags relating to the names for columns and tables (in case of multiple input tables) in the source dataset
- Generated dimensions tags – Tags relating to dynamically generated dimensions, e.g., through automatically enriching a dataset
- Methods tags – Tags added to results that were derived using a particular analytical method, e.g., aggregation or time-series analysis
- Pattern tags – Tags added to results that contain a particular pattern, e.g., an anomaly / outlier or a trend over time
- Hotspot tags – Tags for particular data values that are the subject of any detected pattern
- Story tags – Tags added to results that are grouped into a story. Some results may be part of multiple stories
Tags of the same type are coded in the same colour to make it intuitive to understand which tag carries which meaning.
The Tag Cloud
The set of all tags used in an analysis is available in the Tag Cloud. The Tag Cloud may be accessed via its icon left of the search field.
When selecting tags from the Tag Cloud, only results that match these tags are shown in the user interface. Currently active tags are added to the search field. More precisely, results are filtered so that they match all currently active tags, i.e., implementing a logical AND.
Clicking on an active tag in the search field inverts its effect, displaying only results that do not have the tag in question, i.e., implementing a logical NOT.
Tags that are not applicable to the current selection of insights are deemphasized in the Tag Cloud or optionally not shown at all (via the Tag Cloud configuration at the top right). The sorting order of tags in the Tag Cloud can be adjusted to match the user’s browsing preference by clicking on the sorting icon next the header for each tag group.
Tags are, for the most part, self-explanatory. For more advanced tags, a more detailed description is available by hovering the mouse pointer over them in the Tag Cloud.
Best Practices
- Tags are great for quick exploration – Tags are great for getting a quick overview of a dataset. Select grid view and try some combinations, especially with the pattern tags.
- Negate tags to deal with too many results – Datasets with many dimensions may result in a large selection of results. The quickest way to remove the noise is by using negated tags, i.e., select a tag you are not interested in and then click on it again in the search field to remove all related results.
- Employ user tags to collaborate with others – User tags, added by giving positive feedback to a result, are visible to all users with whom an analysis has been shared. A quick way to collaboratively find the most relevant results is to quickly like some results (even from a mobile device) and then reviewing who found which result interesting.